Tutorial#
For more detail, see the manual in the black binder in Fig. 8, the searchable PDF in our lab’s Google Drive Shared Drive, or by searching for it online. In this tutorial, we will be testing the thermal conductivity of a Pyrex reference sample. It is always a good idea to start your day’s testing with the Pyrex reference sample, so you can compare the measured result with the expected thermal conductivity of 1.143 W/m-K. See the reference material standard values in Appendix D on page 118 of the manual.
Instrument warm-up#
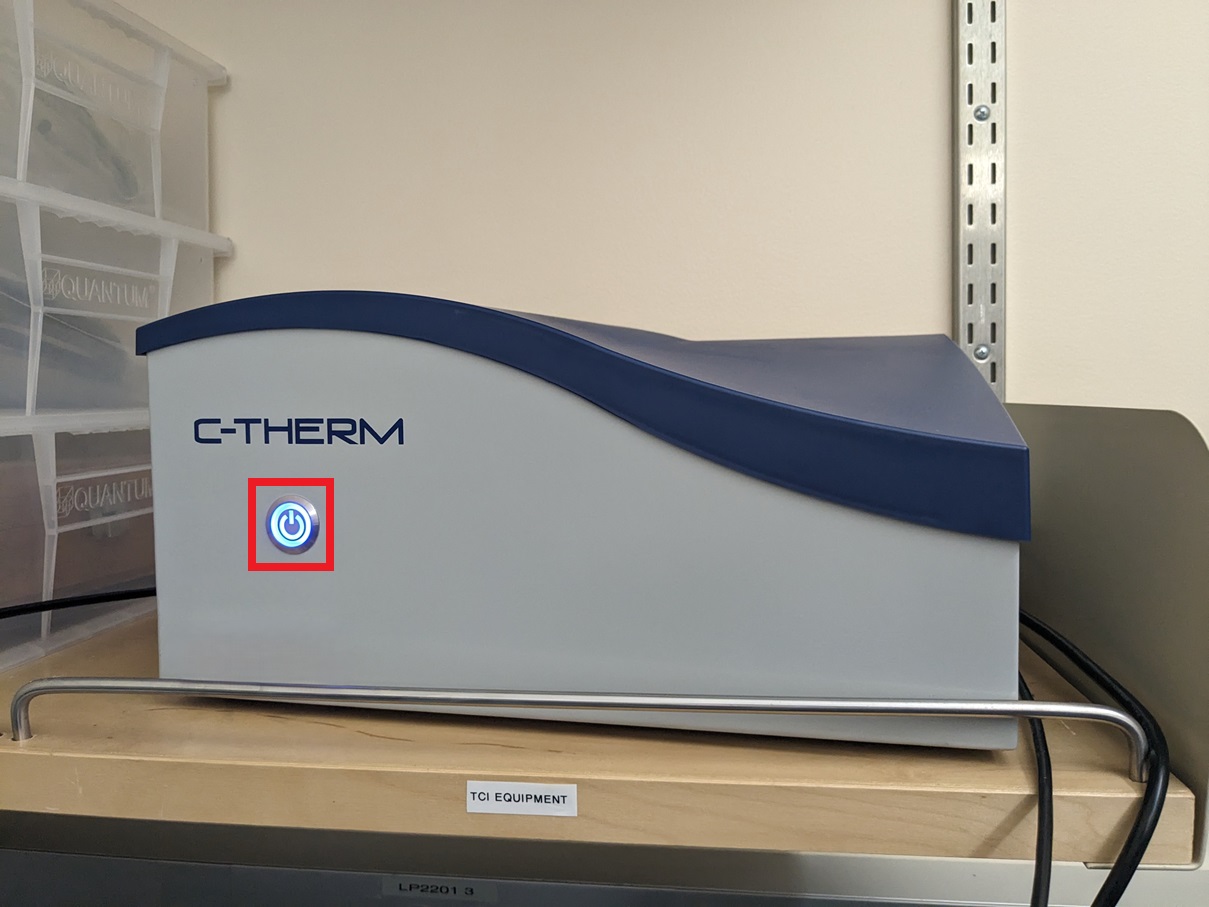
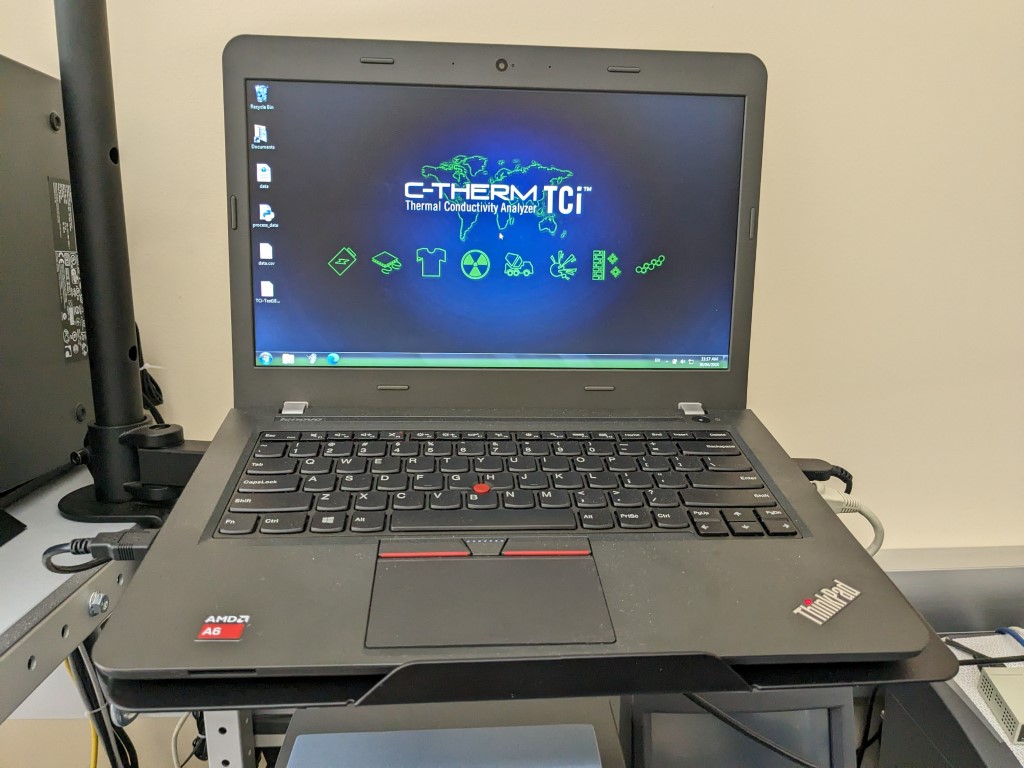
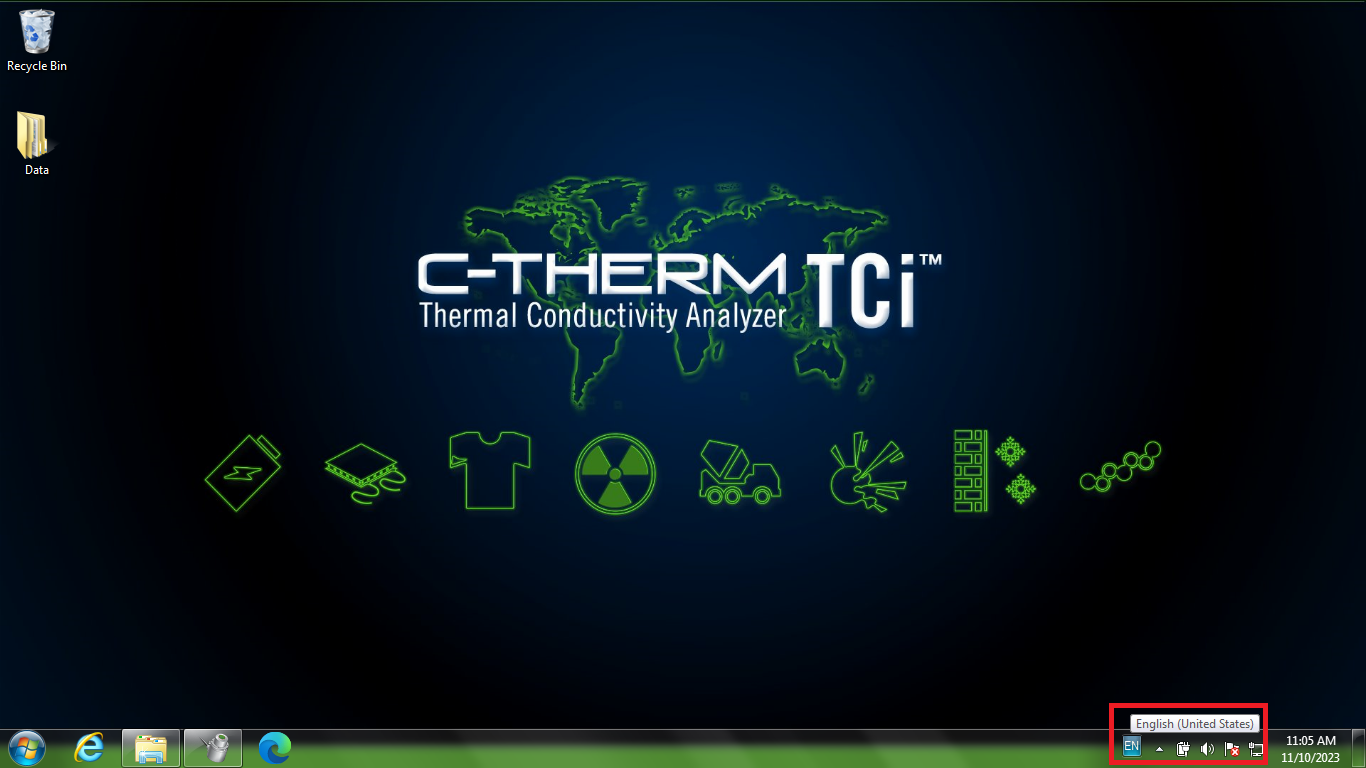
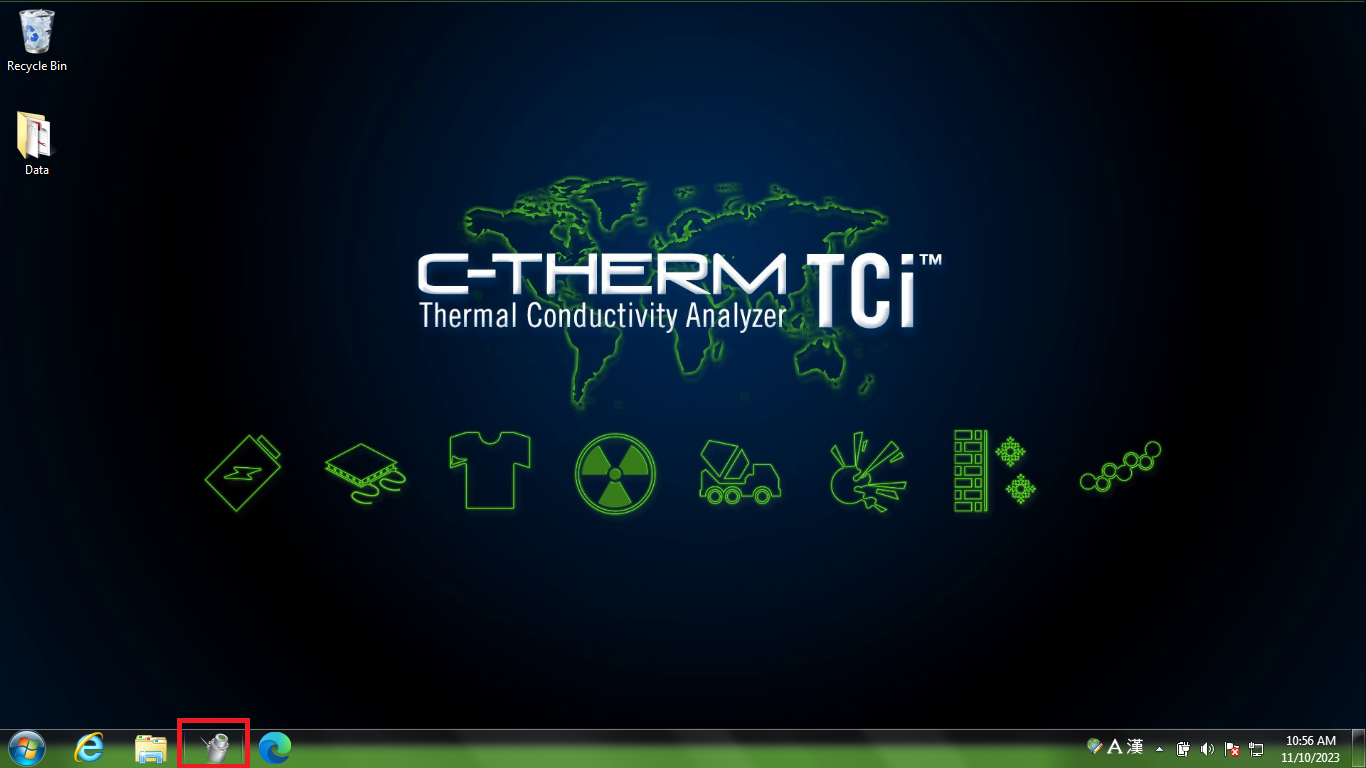
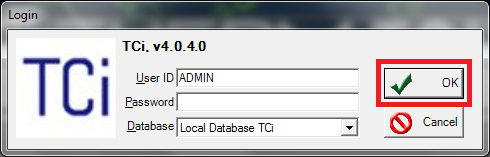
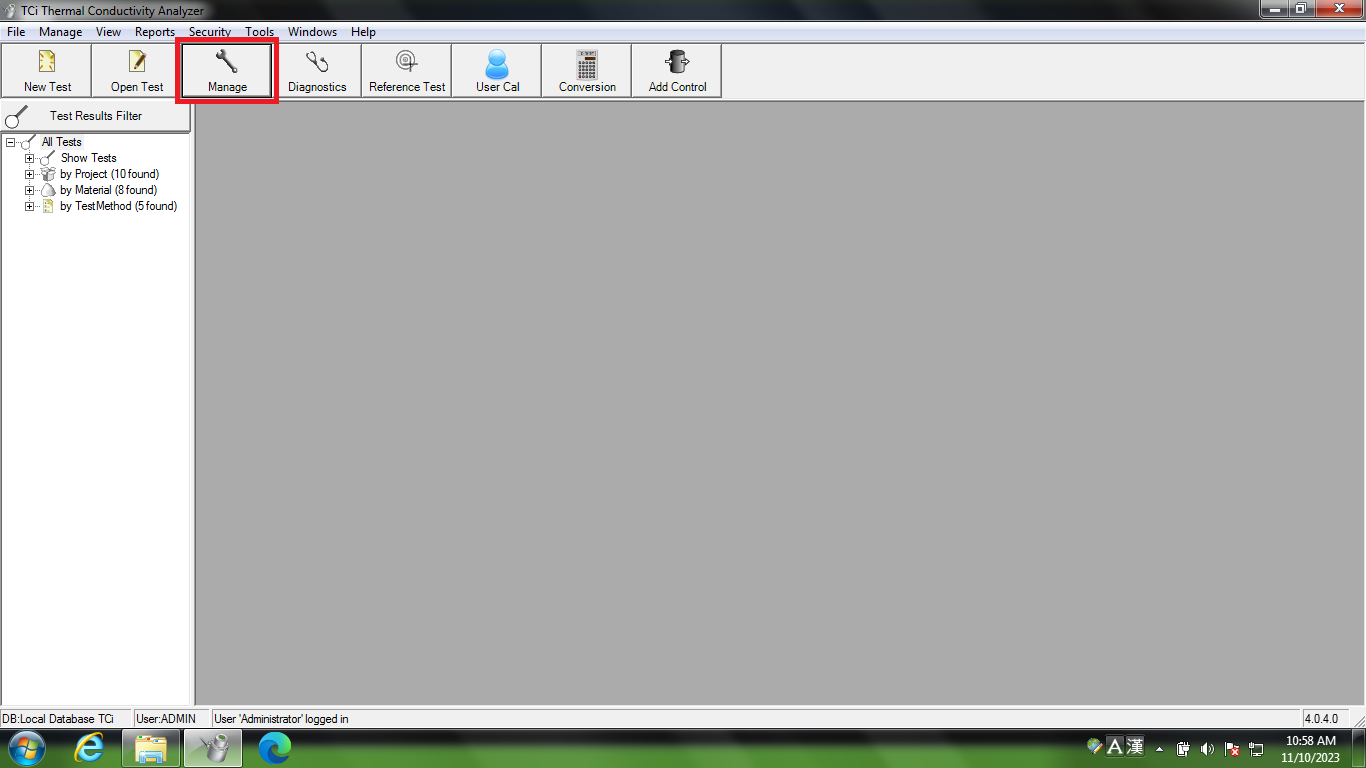
First, turn on the instrument by pressing the power button indicated in Fig. 1, and the laptop associated with this instrument in Fig. 2. Note that the language bar in Fig. 3 may need to be set to “English (United States)” if it is not set already. Open the software by clicking on the icon indicated in Fig. 4, and you will be prompted with the login dialog in Fig. 5. Click “OK” to proceed. The instrument should be left to warm up for about thirty minutes before testing.
Please remember to turn off the instrument and the computer when done testing.
Protect the sensor#
Warning
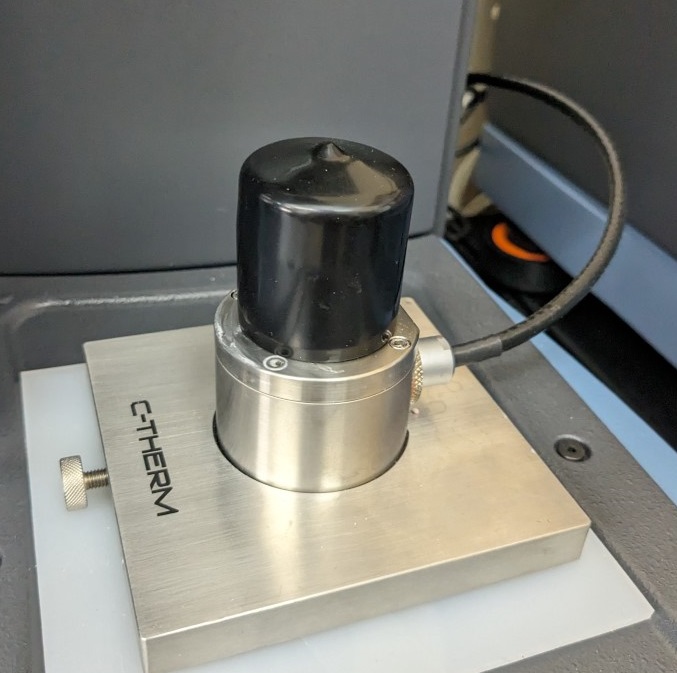
You should always cover the fragile sensor with the protective rubber cap when not in use, as shown in Fig. 10.
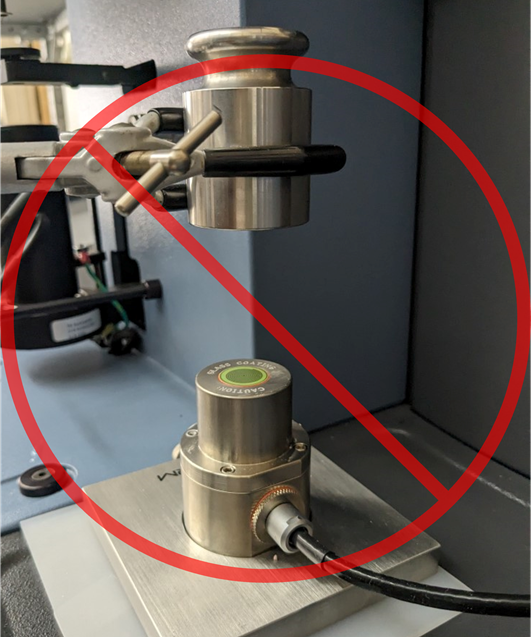
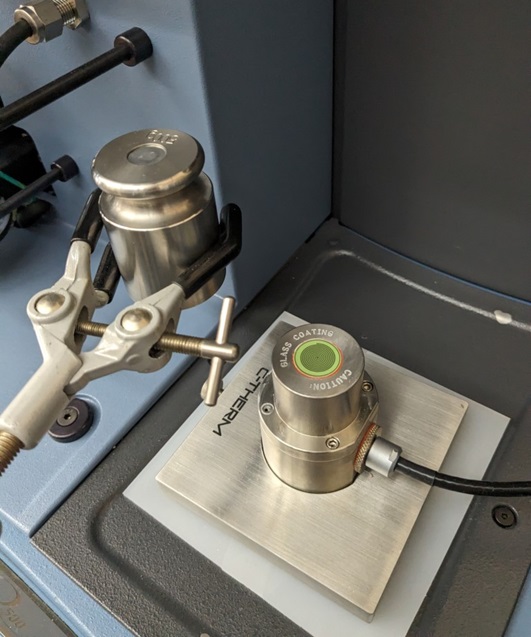
Also, if you use the ring stand to move the mass between tests, be sure to swing the mass out to the side, as shown in Fig. 7. Do not suspend the mass above the fragile sensor, as shown in Fig. 6.
Preparing your sample#
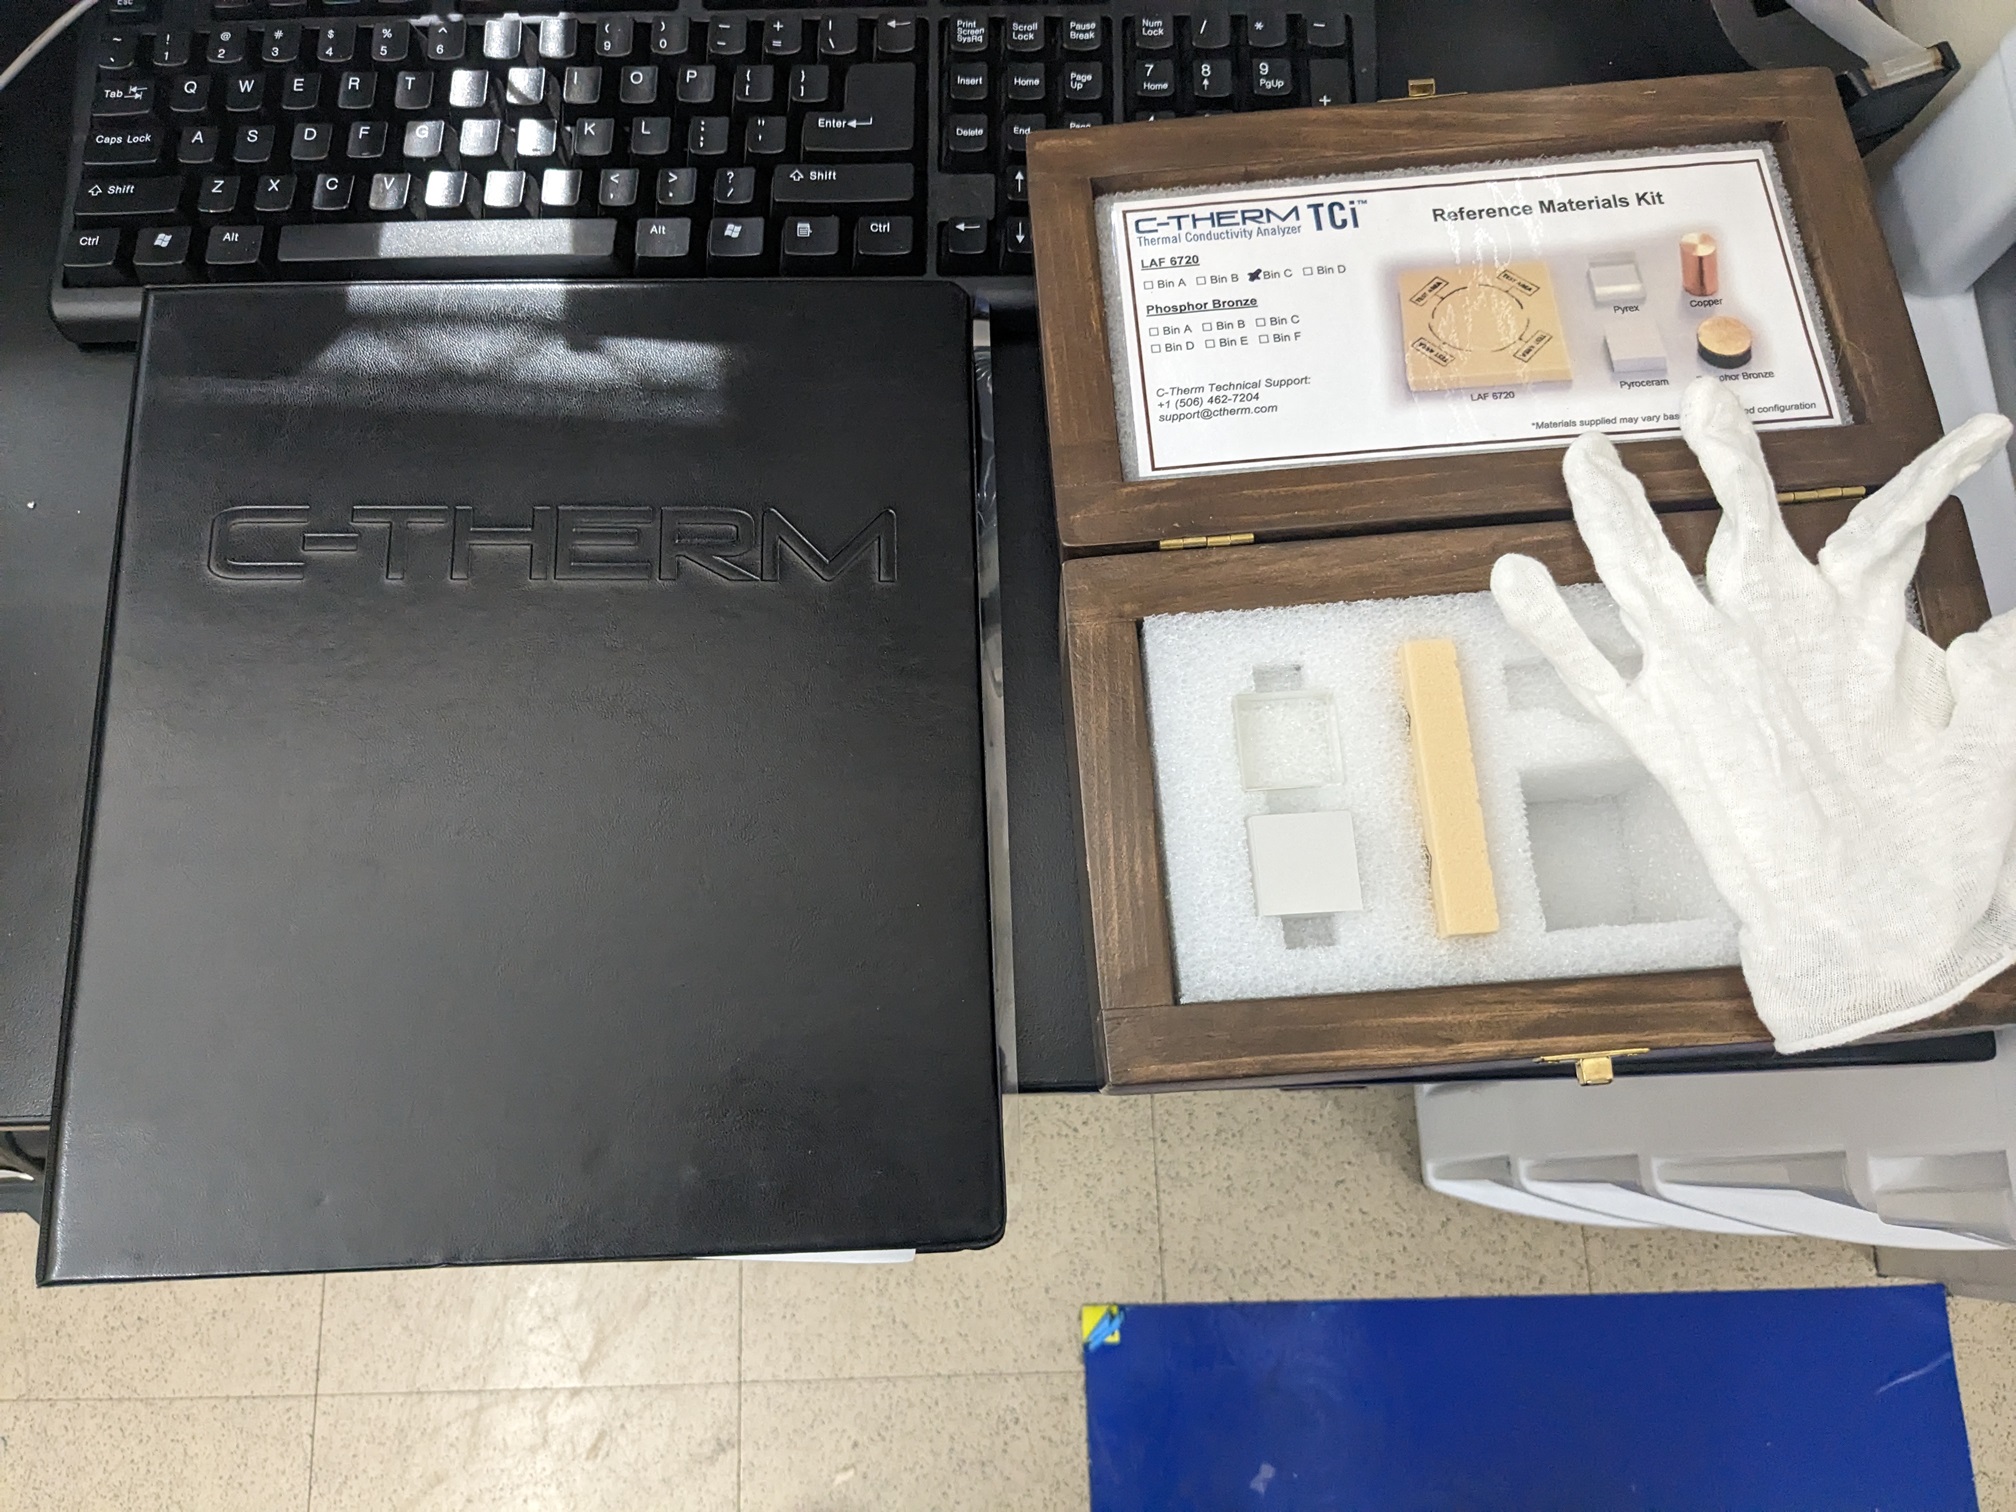
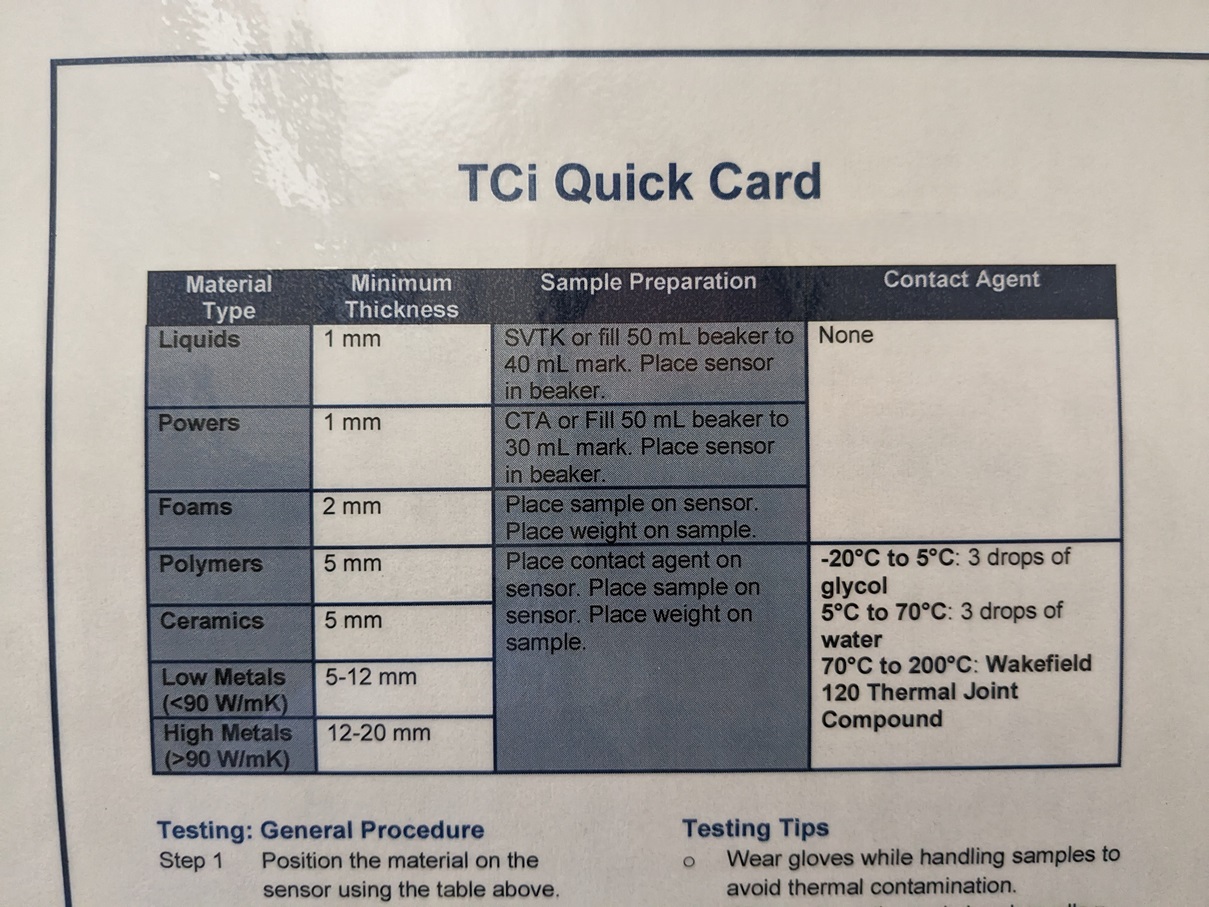
While waiting for the instrument to warm up, prepare your sample for testing. We will test the Pyrex reference material, which has an expected thermal conductivity of 1.143 W/m-K. Locate the manual, reference samples, and quick-reference materials in Fig. 8, to the right of the instrument room entrance. The black binder is the manual, and the quick-reference card in Fig. 9 should be inside the binder. The wooden box contains reference samples, and the glove is for handling the samples.
The process for testing a sample is as follows, with the Pyrex reference sample given as an example:
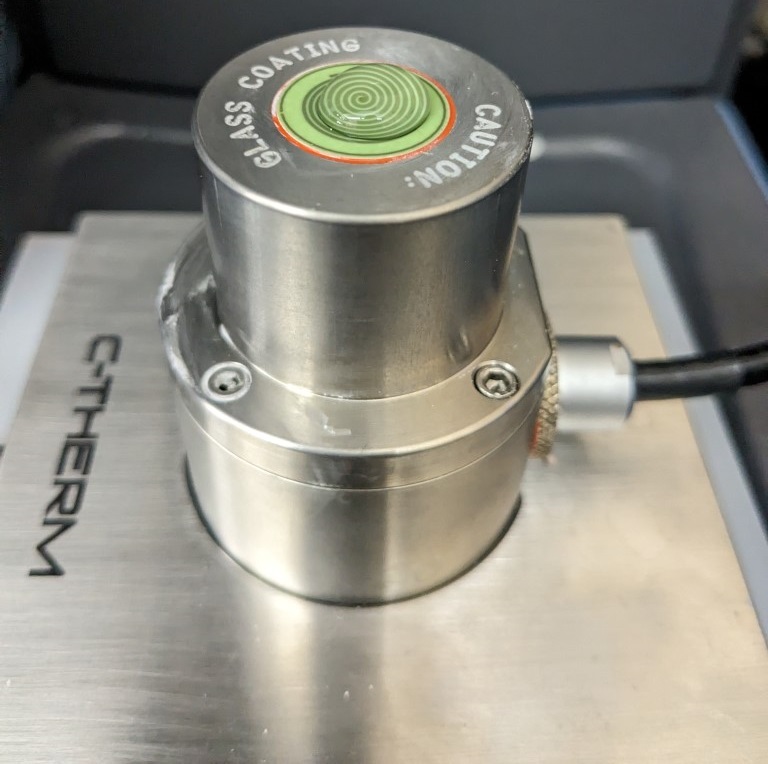
Remove the cap from the sensor, shown in Fig. 10.
Apply about four drops of deionized water as the contact agent for polymers, as in Fig. 11.
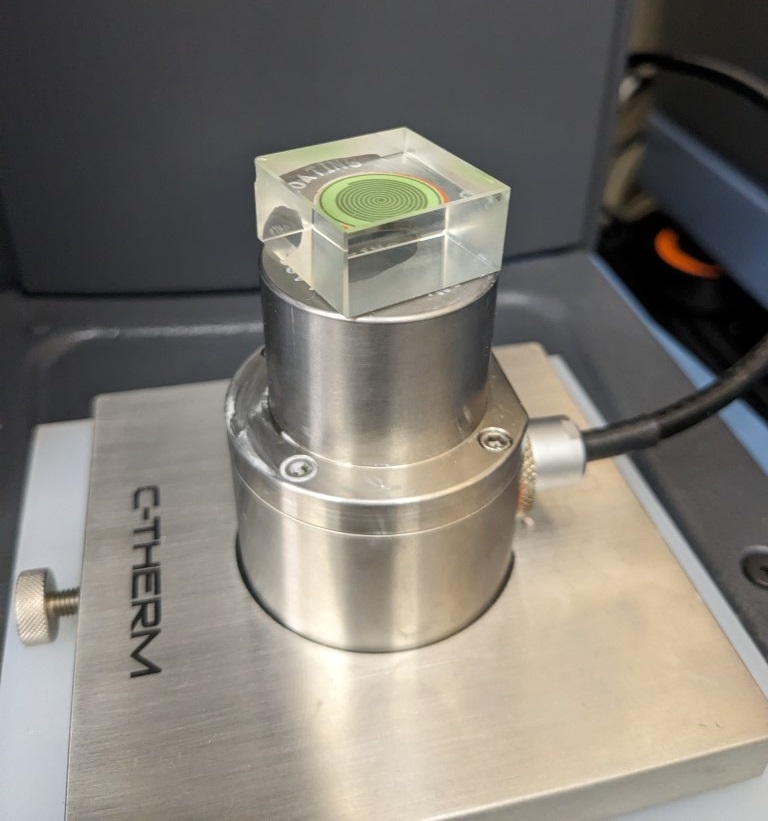
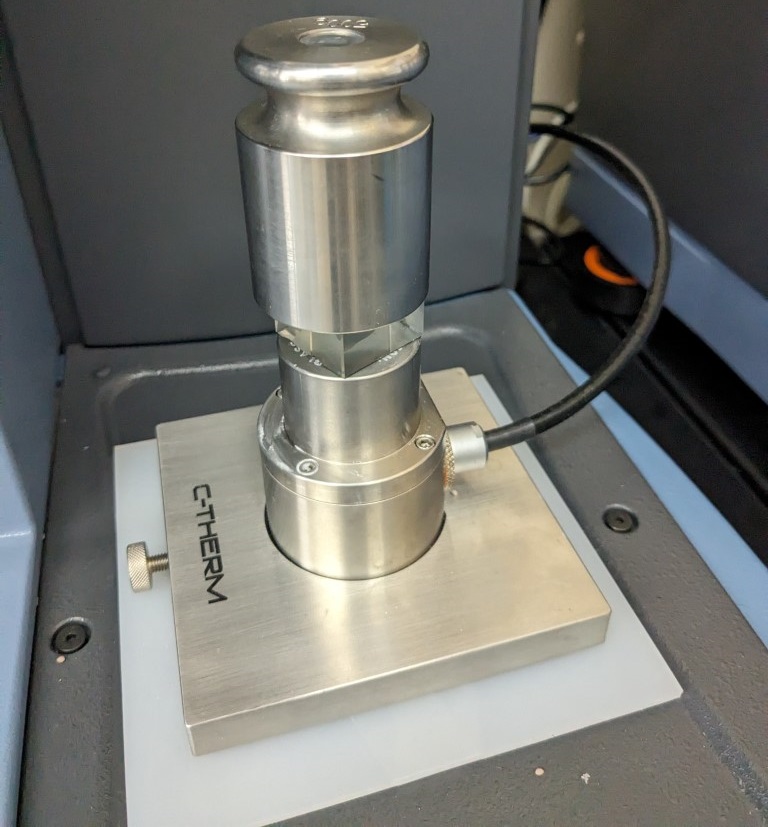
Place your sample on the sensor as in Fig. 12.
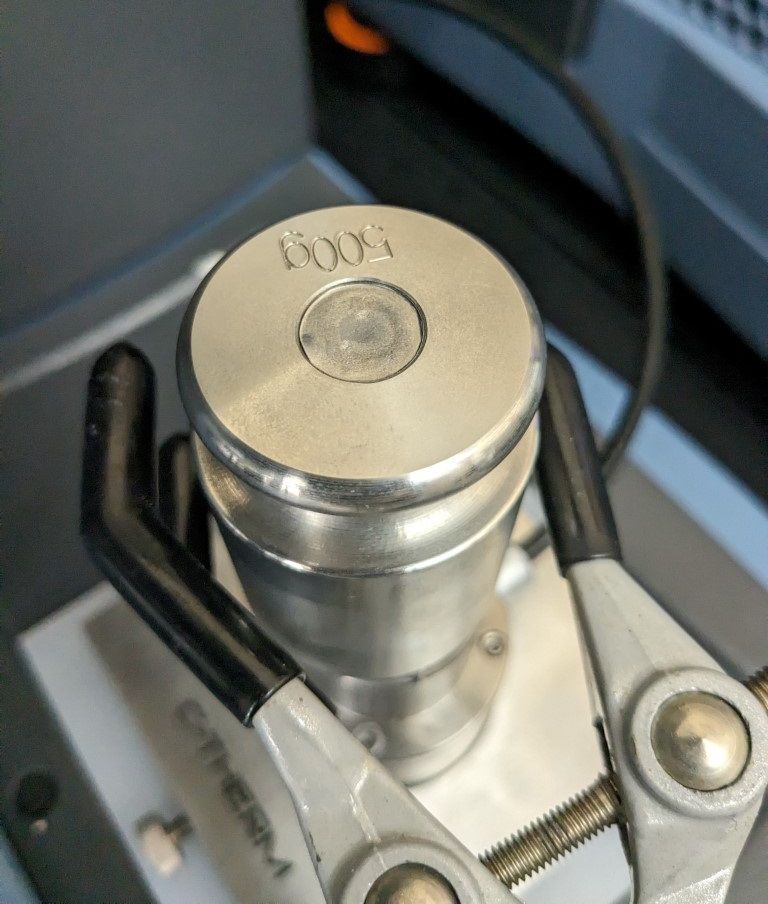
Place a 500 g mass on top of the sample as in Fig. 13. The mass is located in the wooden box in Fig. 8.
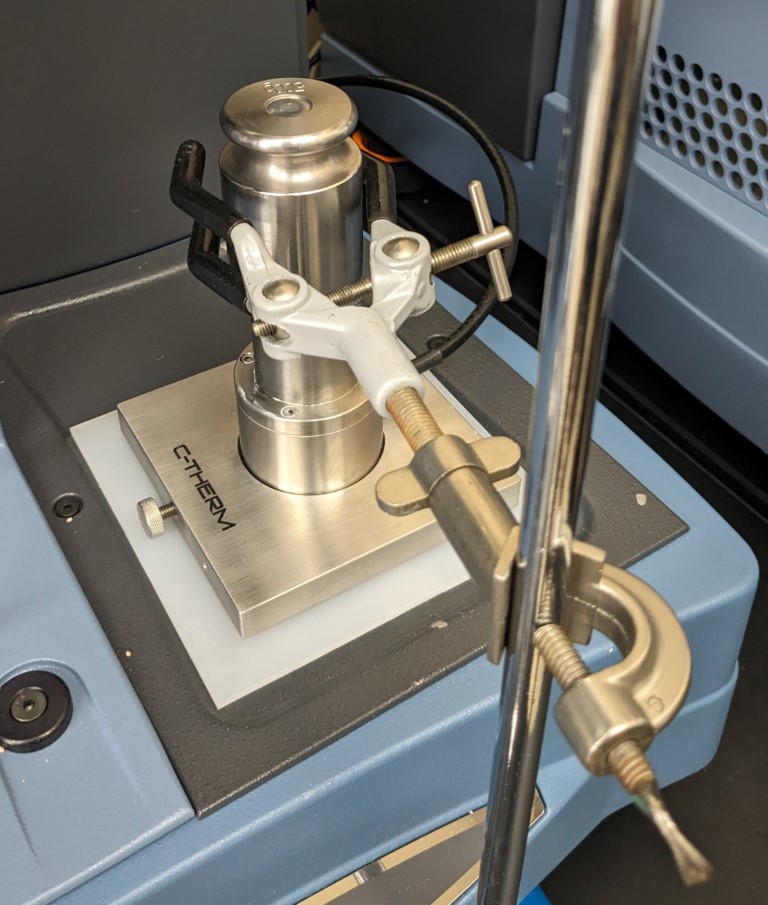
Set up a ring stand and clamp to prevent the mass from falling off the sensor, as shown in Fig. 14. Position the clamp close to, but not touching the mass as in Fig. 15.
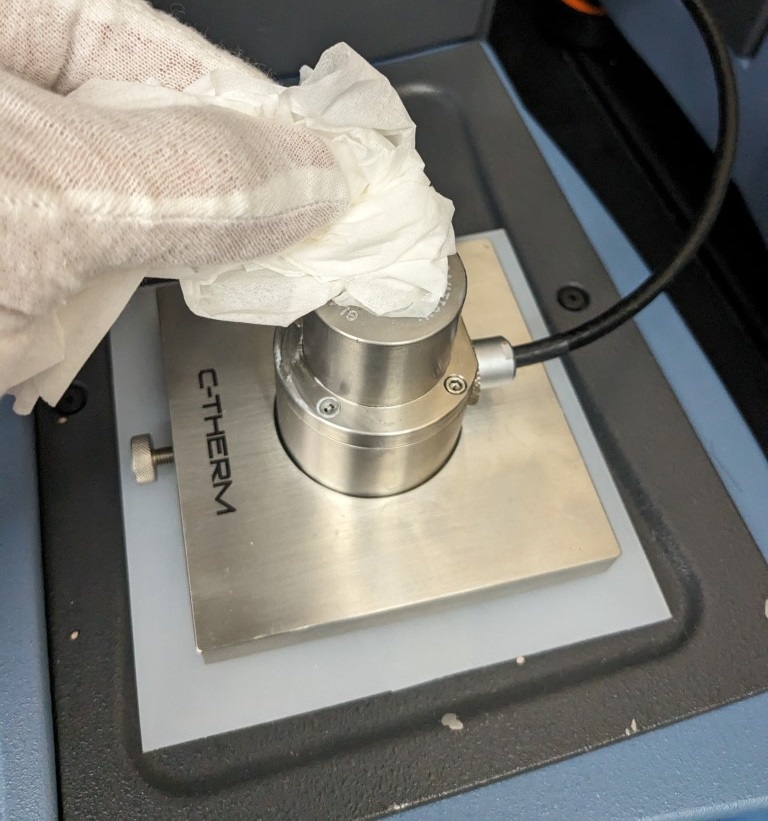
Now you are ready to follow the process for Starting a test. If you are done testing, or changing contact agents, use a lab wipe to dry the sensor with a gloved hand as in Fig. 16, and replace the cap on the sensor as in Fig. 10.
Starting a test#
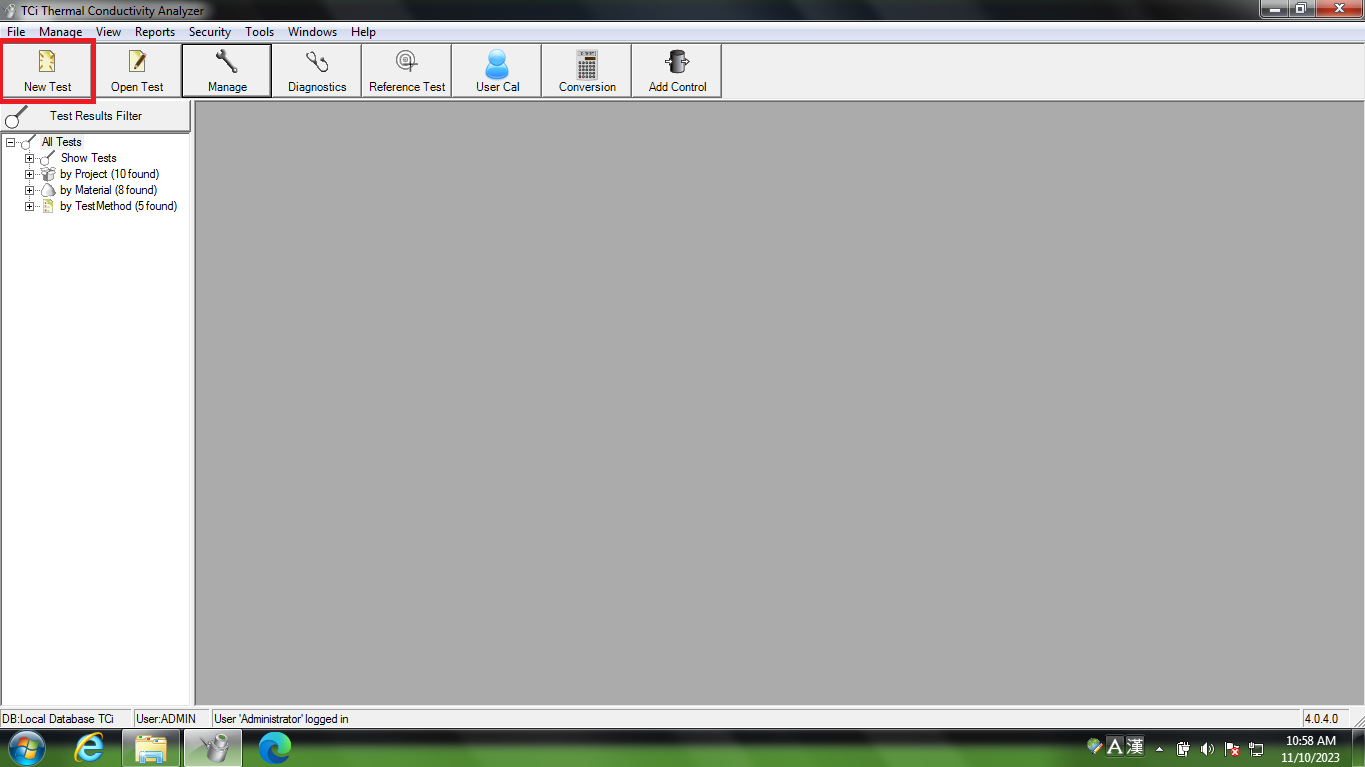
Once you have finished Instrument warm-up and Preparing your sample, you are ready to begin testing. By making good selections during test setup, such as setting “Material Group”, “Material”, and “Material Lot” appropriately, it will be easier to process the data after Exporting results. After the login process, the main screen will appear. Start a new test by clicking the “New Test” button as shown in Fig. 17.
Tip
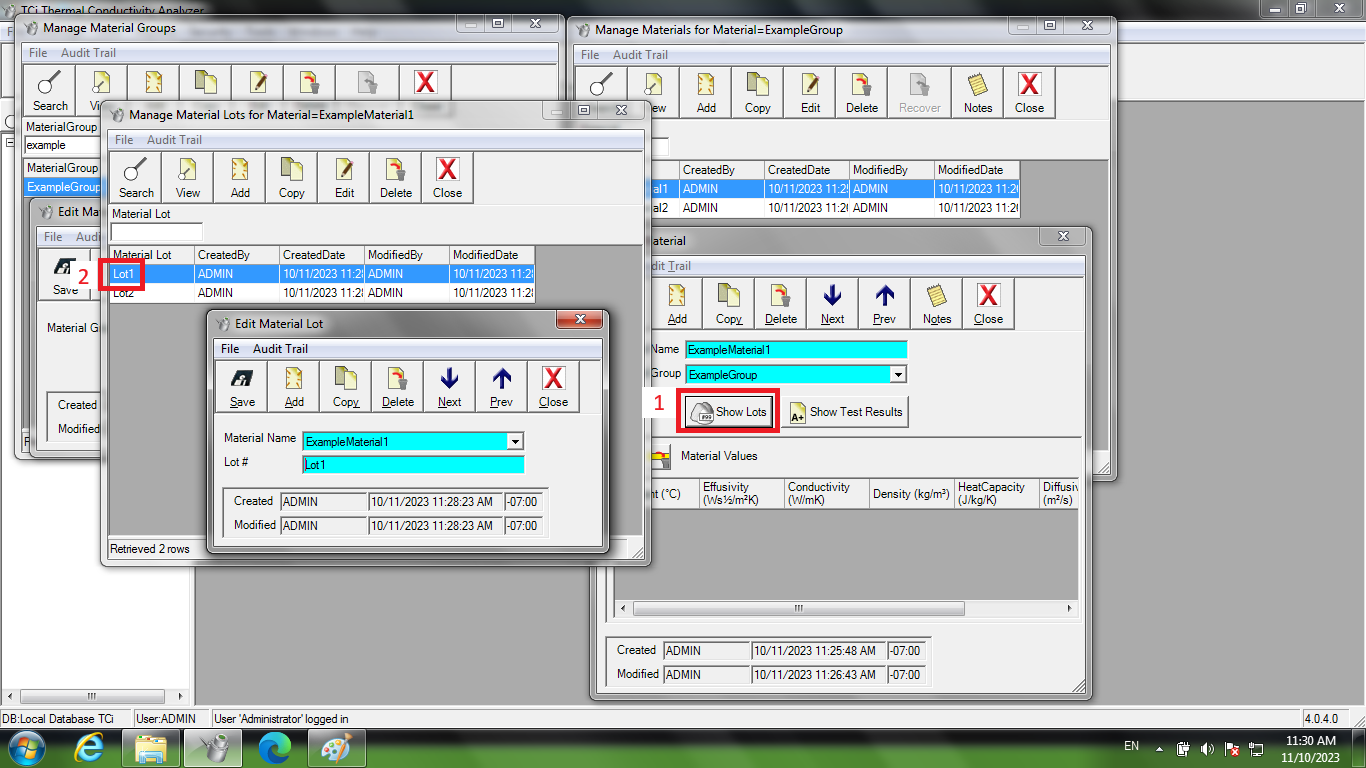
If you are testing a novel sample, make sure to define a unique “Material Lot” to differentiate between it and other tests of the same material. See Categorizing your samples for details.
Click “Next” after each of the following steps:
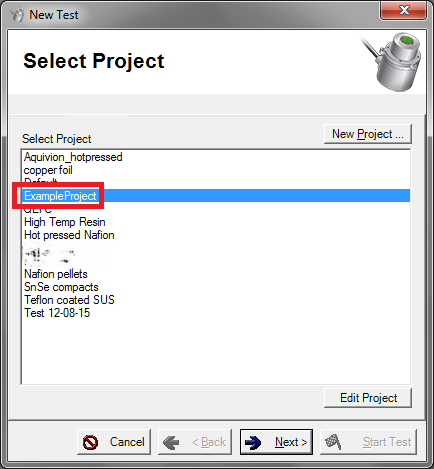
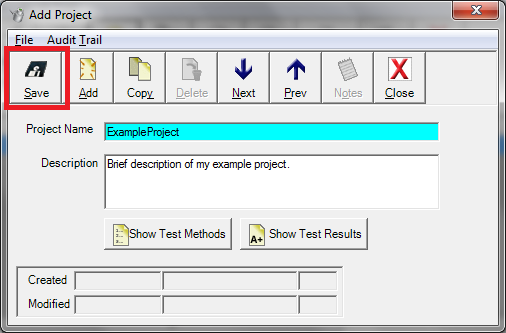
Select your project as in Fig. 18, optionally creating one as in Fig. 41.
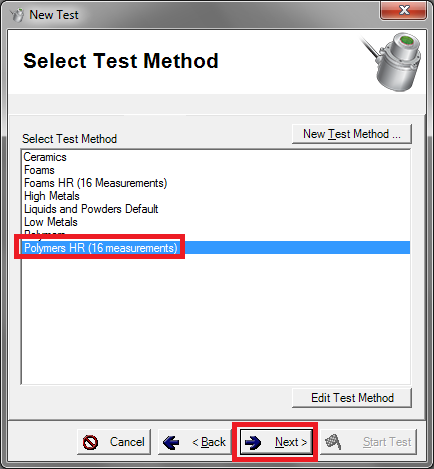
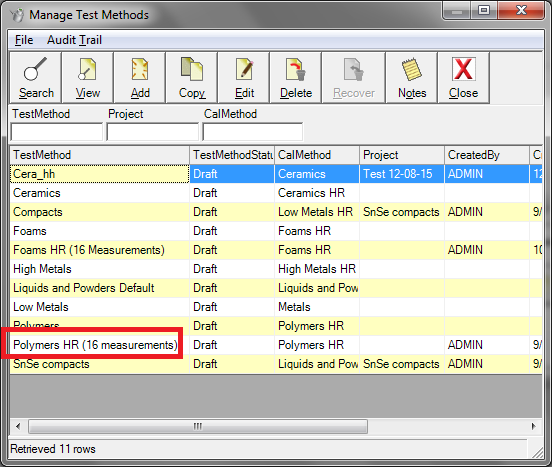
Select an appropriate test method for the material you intend to test as in Fig. 19. You will usually select “Polymers HR”, for example with Pyrex. See Creating a test method for more detail.
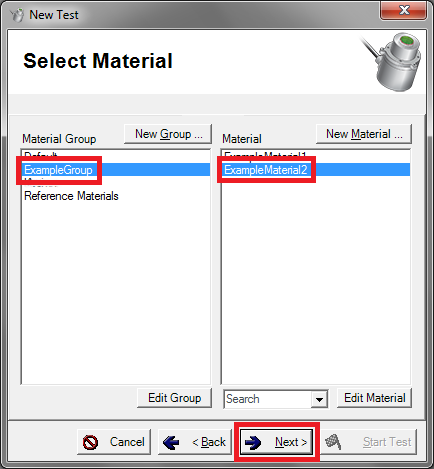
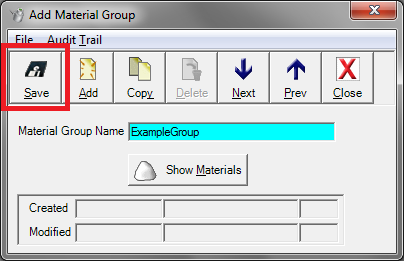
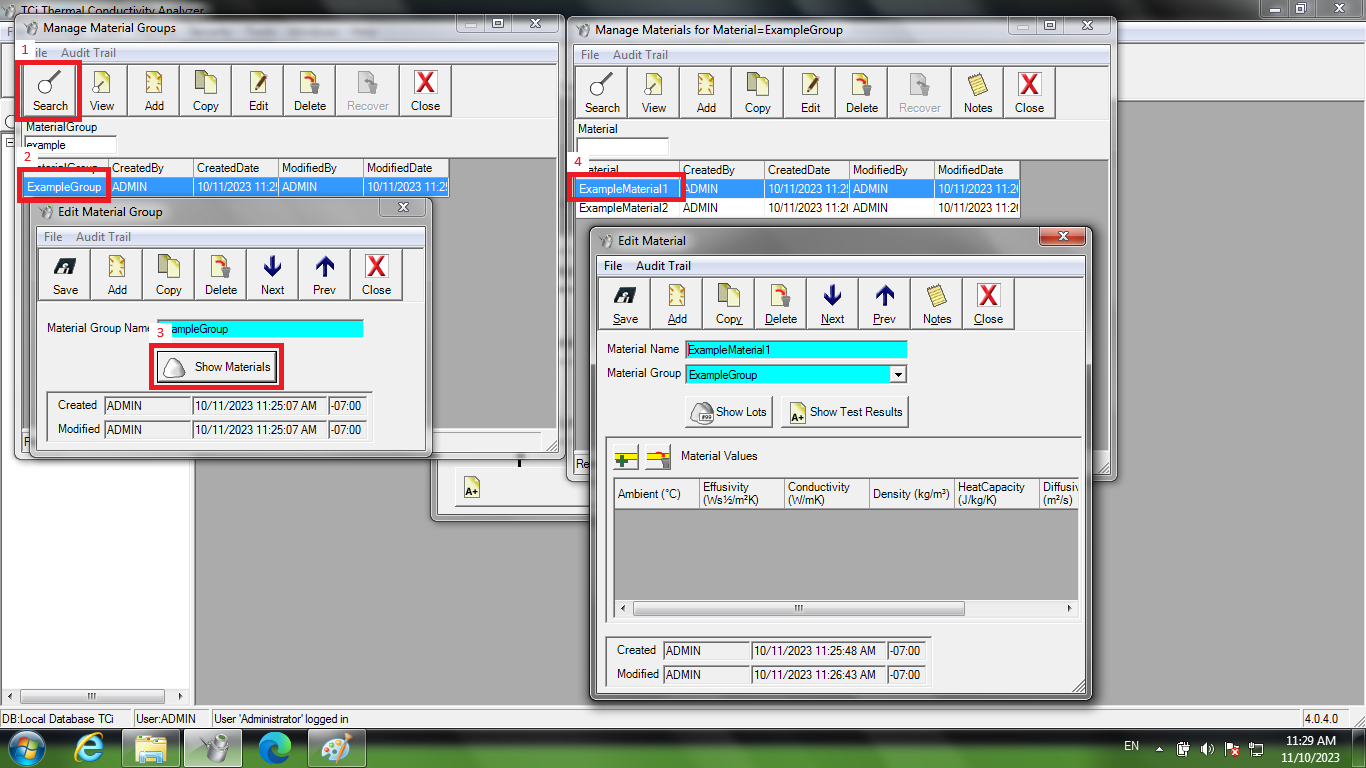
Select the Material Group and Material you are testing, as shown in Fig. 20. For Pyrex, select “Reference Materials”, then “Pyrex”. You may optionally create one as in Fig. 38 and Fig. 39.
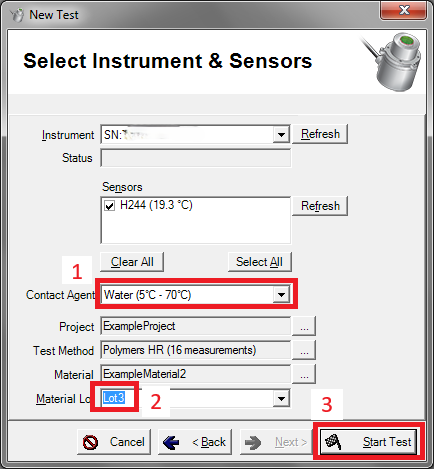
On the final screen before the test begins, make the following selections in order as in Fig. 21:
Important
Make sure you follow these steps in order, otherwise you may encounter a bug in the software. See Something went wrong with setting a "Material Lot" at test time for more detail.
Select the contact agent you are using, which will usually be water, but could be thermal grease.
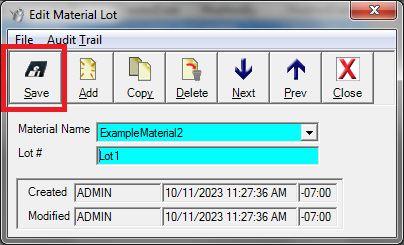
Select or type a new “Material Lot”. This “lot” might represent a unique sample identifier, like a date or a number indicating some percent-by-weight of an additive. For instance a lot like “2024-04-30” or “3-cnt” could differentiate your samples from the general “Nafion 117” material.
Click “Start Test”.
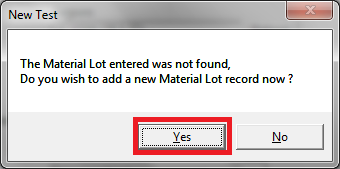
If you are prompted to create a new lot, click “Yes” as in Fig. 22.
Tip
You don’t need to select a “Material Lot” for the Pyrex reference sample.
Proceed to Checking on a test run to monitor the test for the first few measurements, after which you can leave it unattended.
Checking on a test run#
Important
Don’t touch the sample from this point onward.
After clicking “Start Test”, the test will begin. You will want to monitor the first few measurements before leaving the instrument to finish unattended. The initial waiting period is defined as in “Delay before first measurement” in Fig. 43 will begin, causing “Wait: Initial” to appear as in Fig. 23.
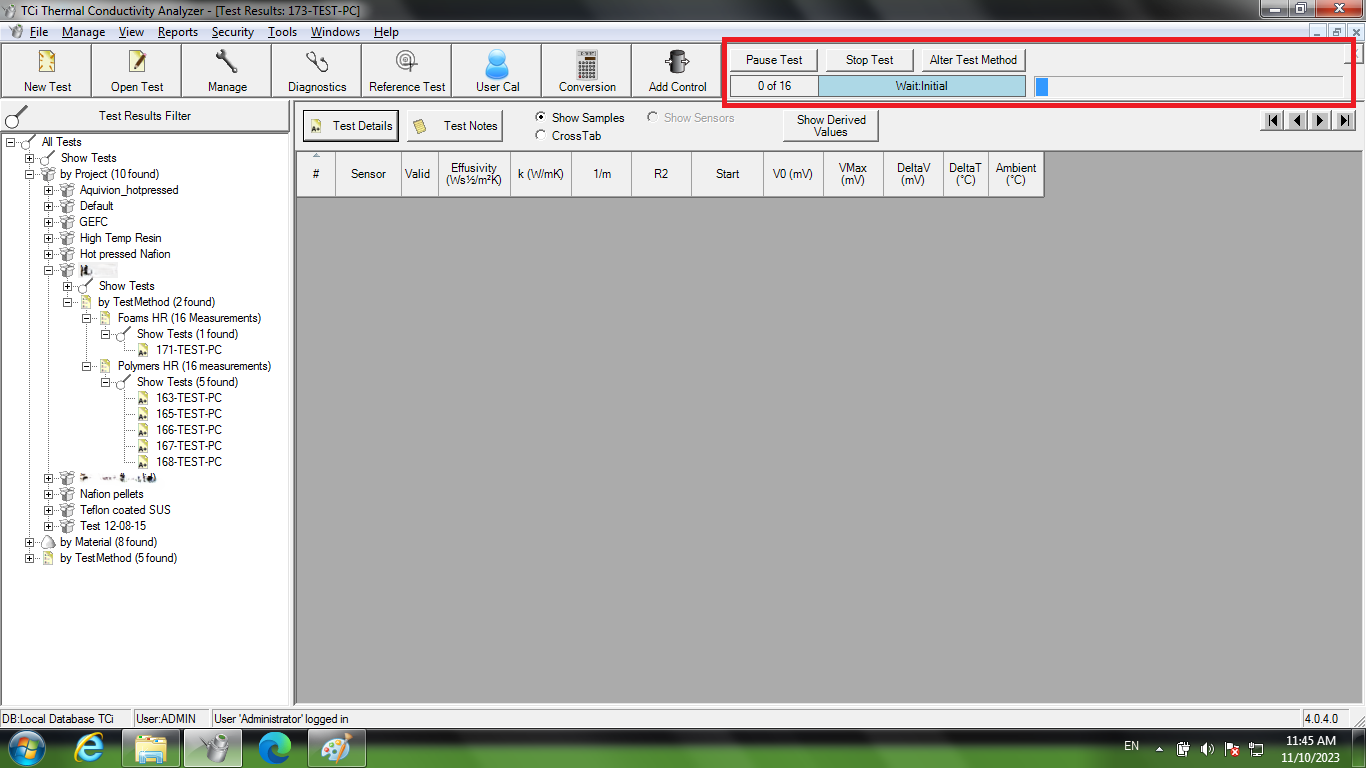
Fig. 23 Initial waiting period as test begins#
The active test indicator will read “reading sample” as in Fig. 24 when a measurement is being taken. Wait for a few measurements to appear before leaving the machine to finish the test run.
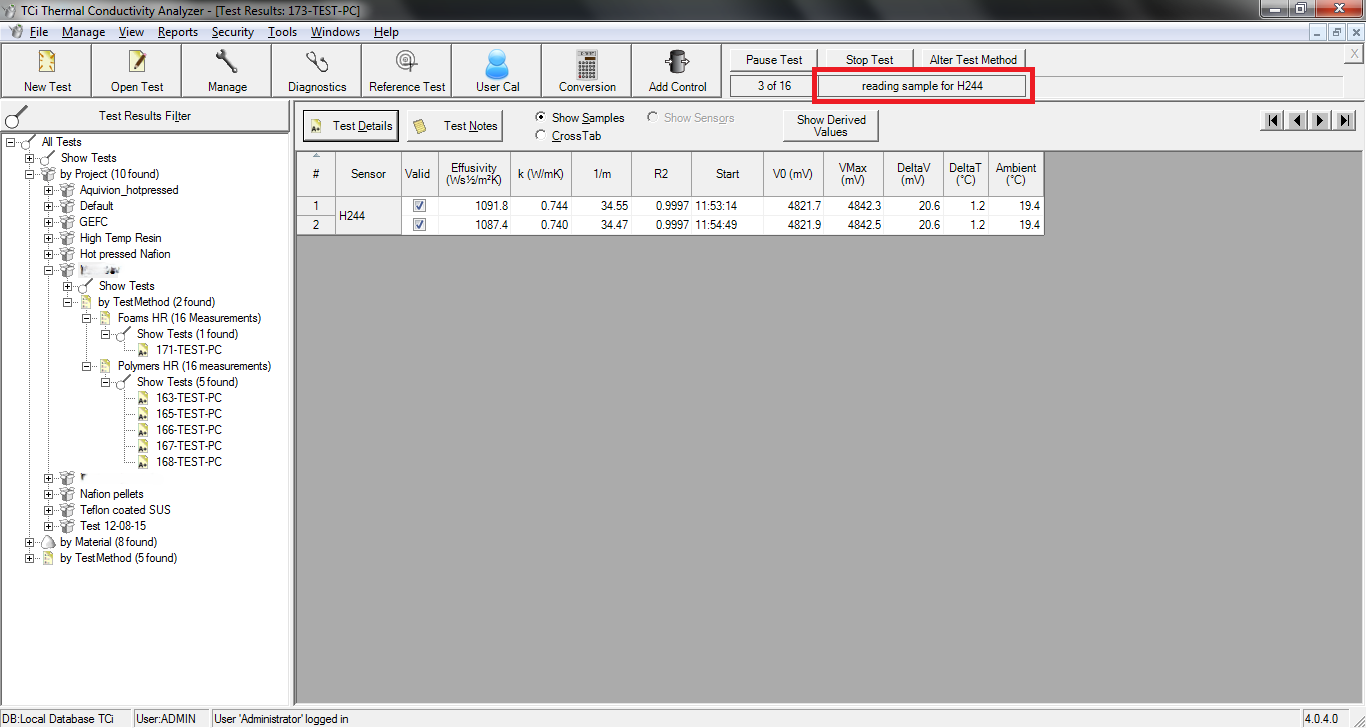
Fig. 24 Test in progress with reading being taken#
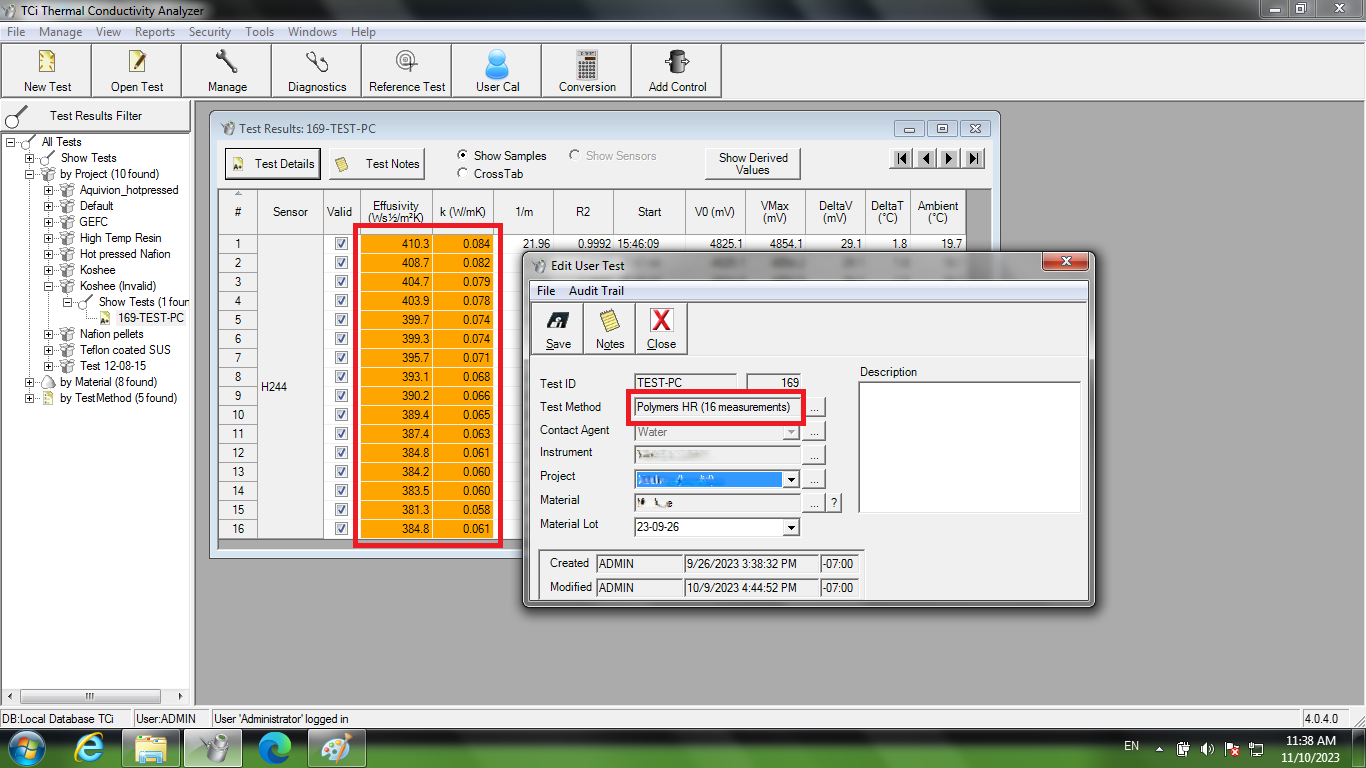
If the measurements are in-range for the selected test method, the background will be white as in Fig. 25. If the measurements are out-of-range, the background will be orange as in Fig. 26. This means that the test method chosen, for instance “Polymers HR”, is not appropriate for the material being tested. Our instrument only has calibrations for polymers and foams, and each test method has an acceptable range to which it applies.
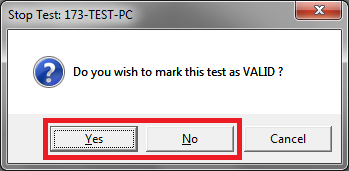
You may encounter other issues, such as drifting or inconsistent thermal conductivity measurements. See Troubleshooting for details. If you click “Stop Test” and cancel a test before it finishes, you will be prompted with the dialog in Fig. 27. Choose whether to mark the test as valid and continue.
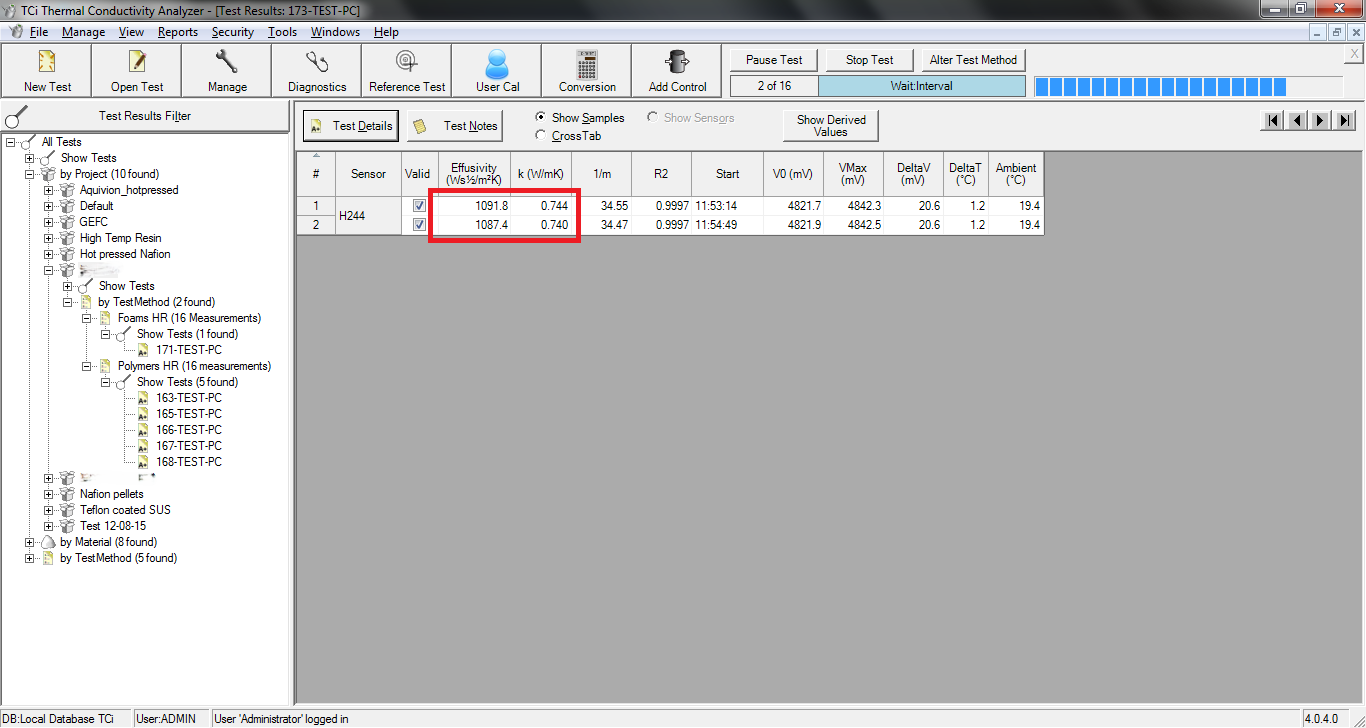
A completed and successful test looks like Fig. 28, with a white background across all measurements, indicating that they are in range. You still may notice variabliity in repeat tests, or have trouble reproducing the results on different days. See Troubleshooting for details or review the manual.
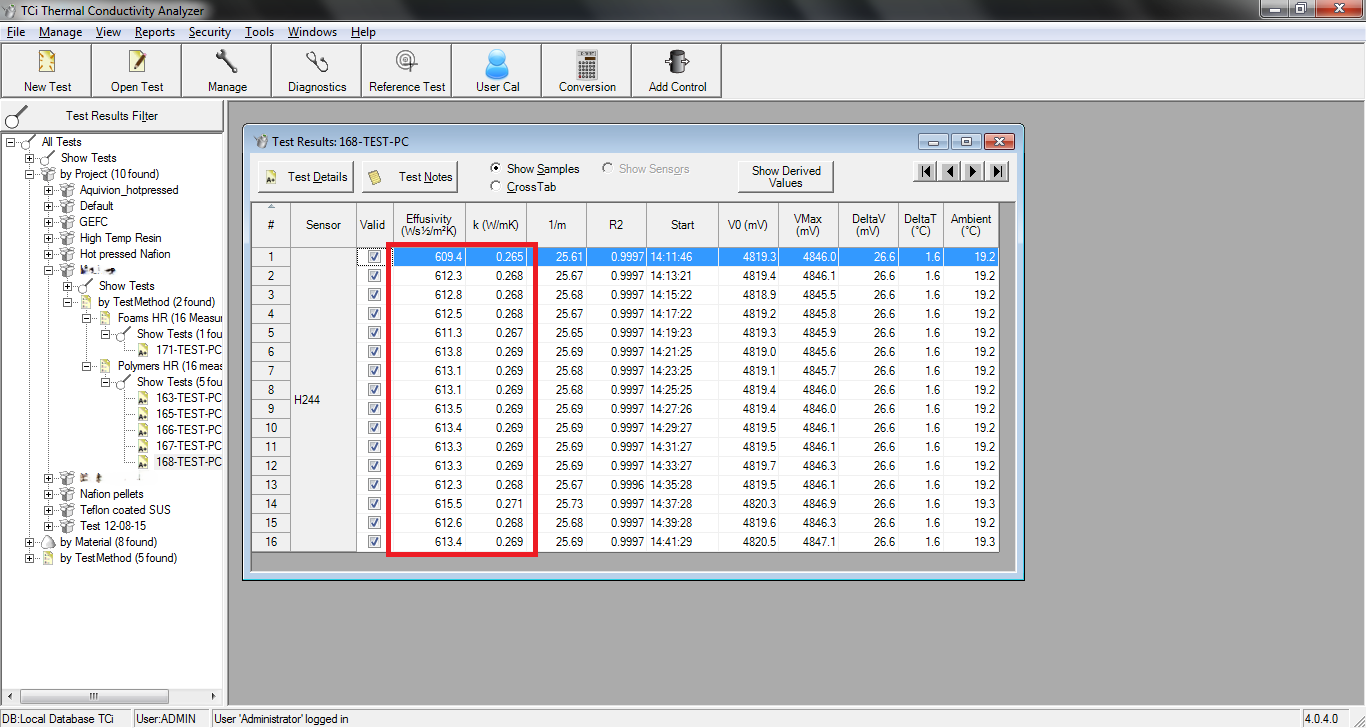
Fig. 28 Example of in-range measurements with white background for a given test method#
If you ran a test with Pyrex, check that the thermal conductivity values are similar to its expected thermal conductivity of 1.143 W/m-K. You may also test the LAF 6720 foam reference sample, choosing the “Foams HR” test method instead. See the reference material standard values in Appendix D on page 118 of the manual.
When you are ready to get your data off of the machine for processing, see Exporting results.
Exporting results#
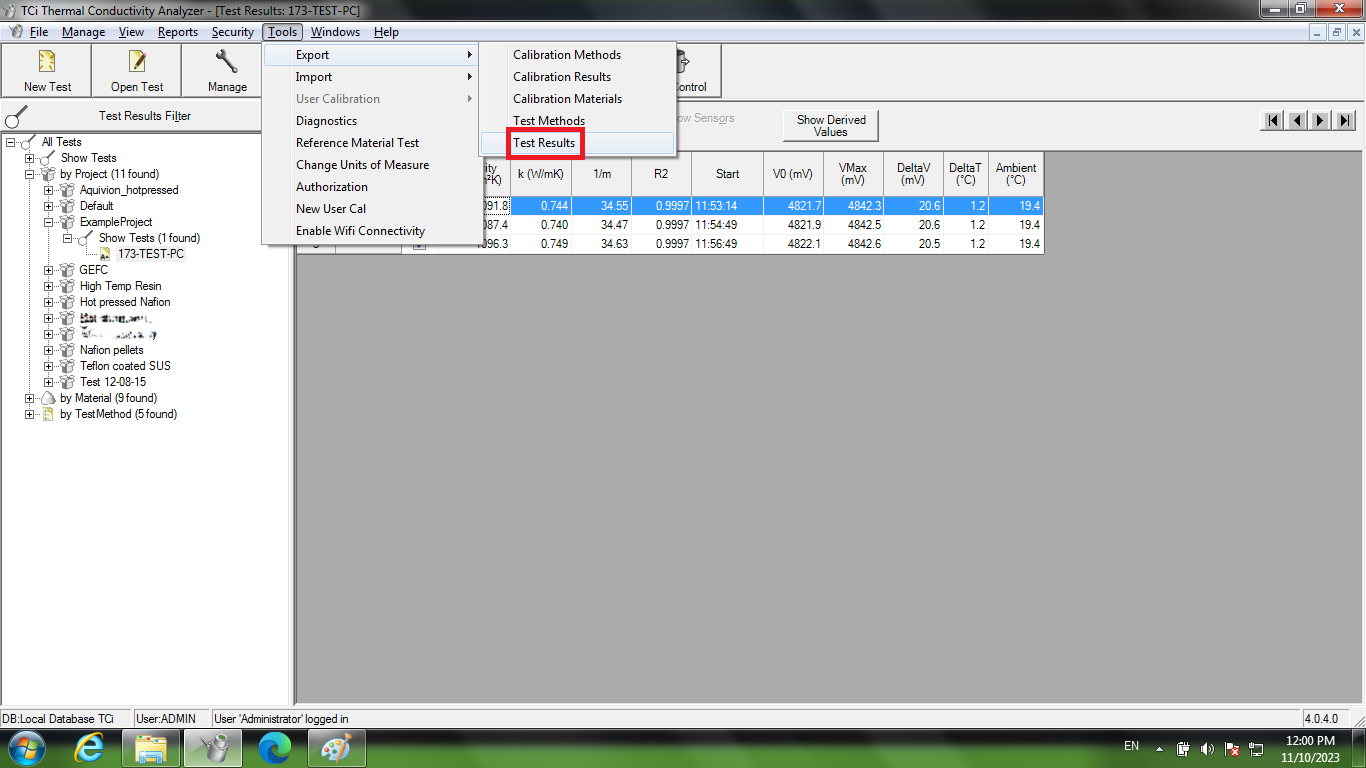
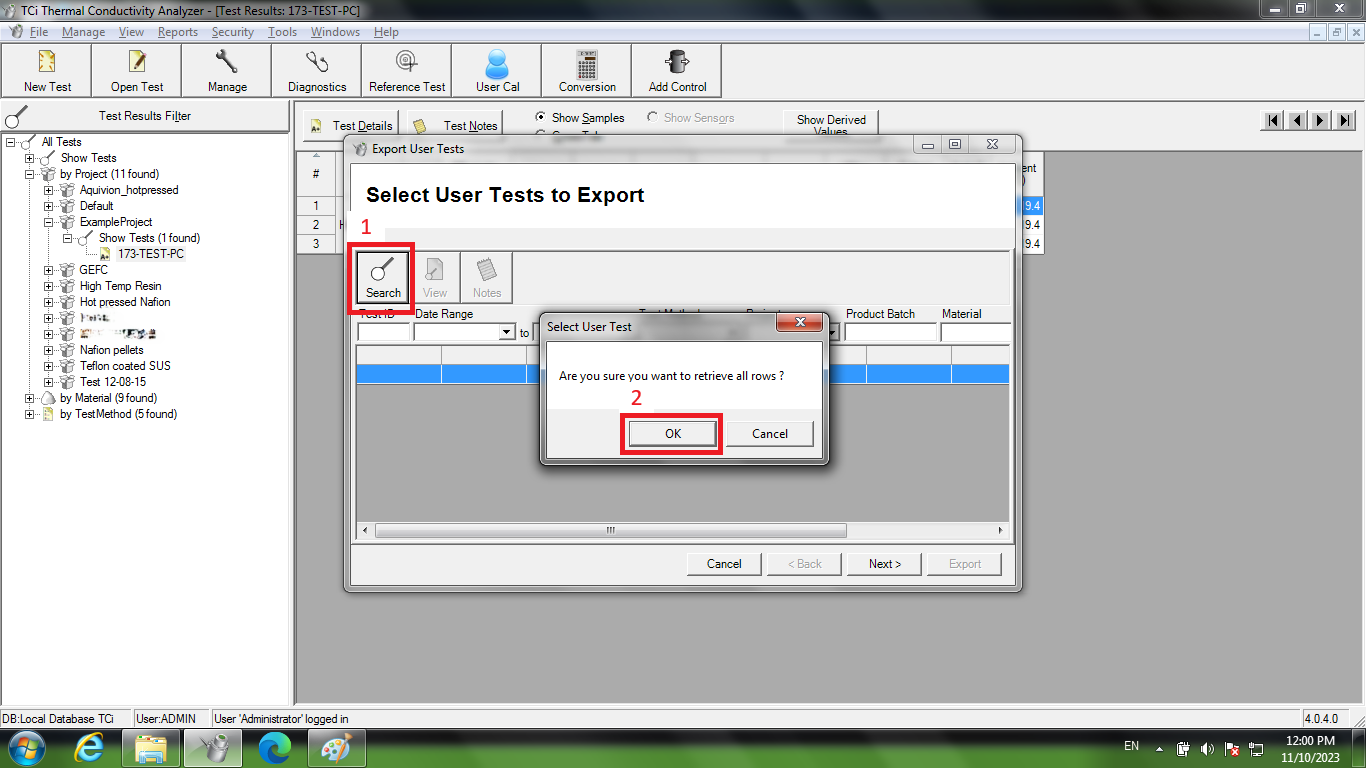
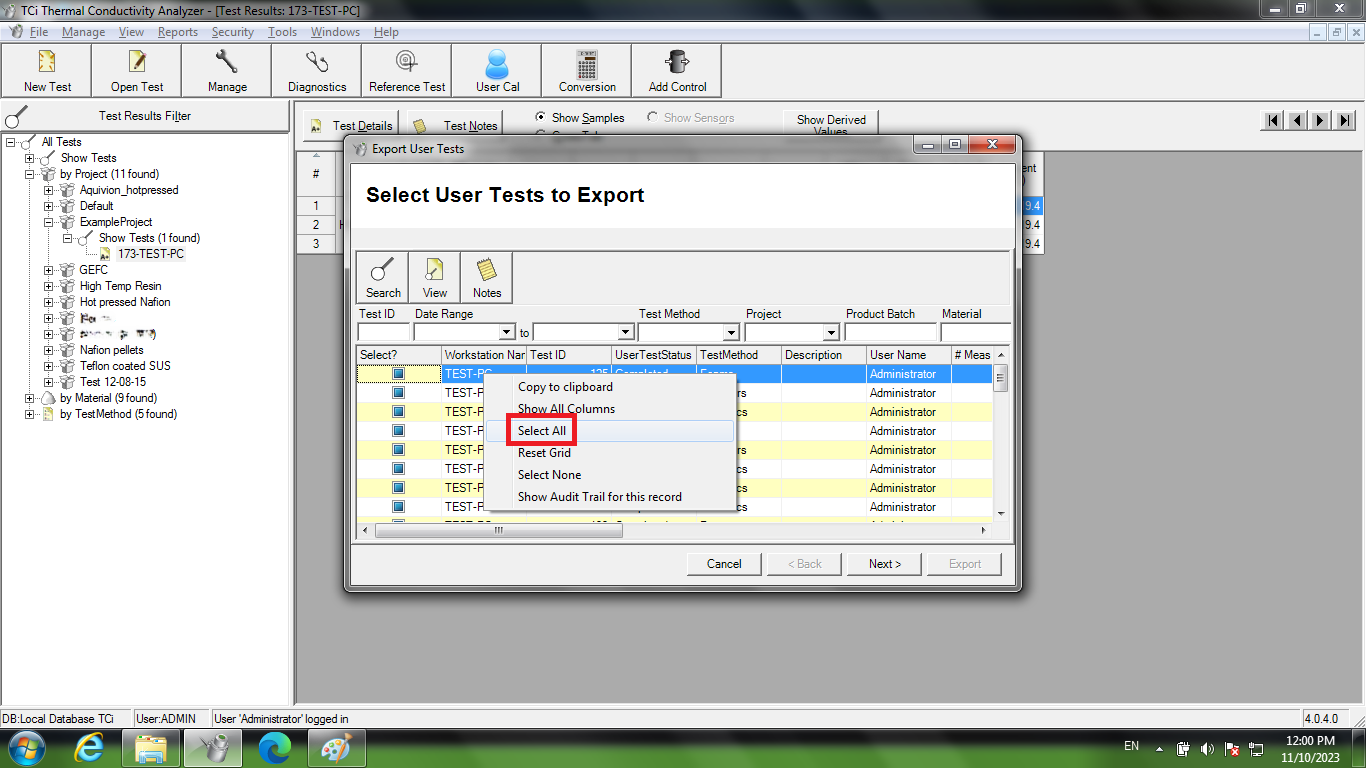
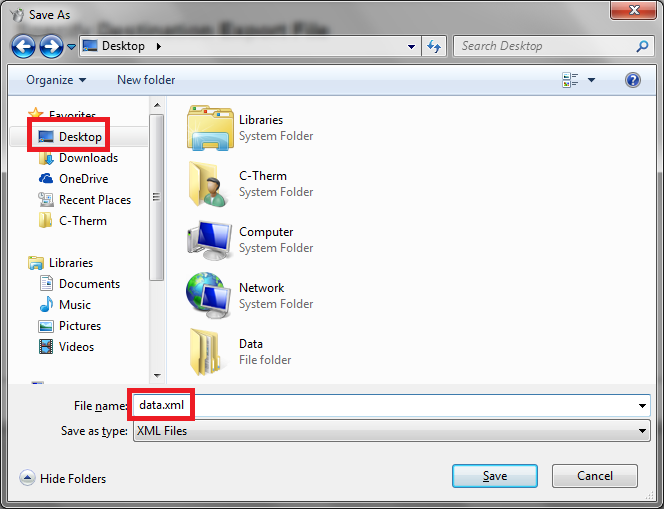
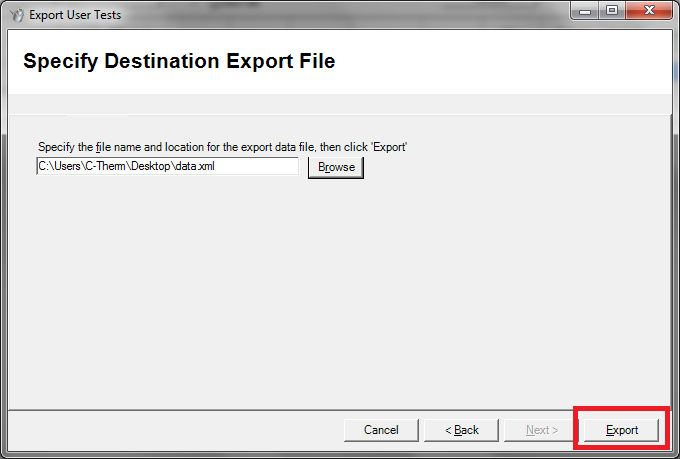
Follow the process below from Fig. 29 to Fig. 33 to export an XML file of all tests. It is easier to export and process all tests than to just process the latest ones, as the data process includes an Excel file which takes averages of measurements grouped by Project, Material Group, Material, and Lot Number.
Search for tests#
You can search for test results using the “Open Test” dialog. Note that the * character functions as a wildcard when searching as in Fig. 34.
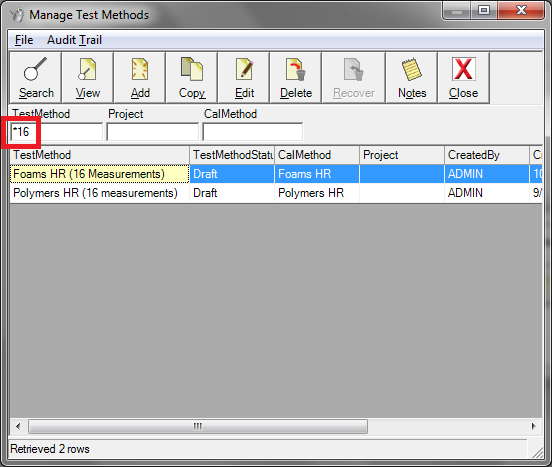
Fig. 34 Example of searching by wildcard using “*”#
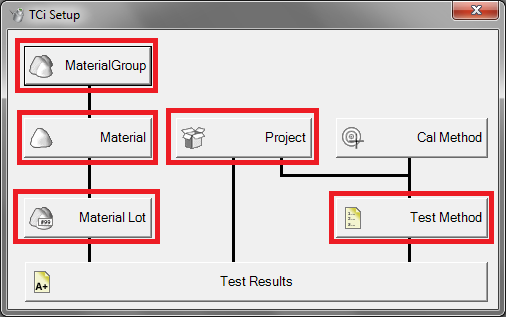
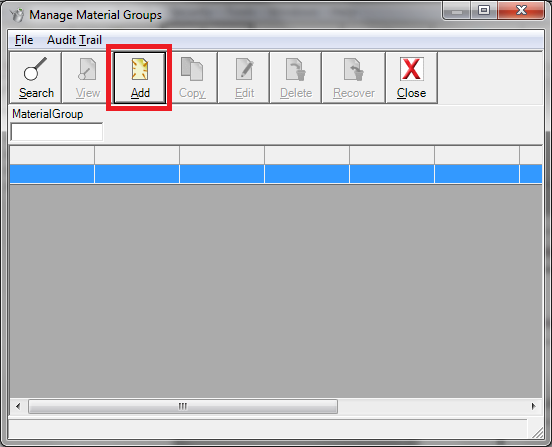
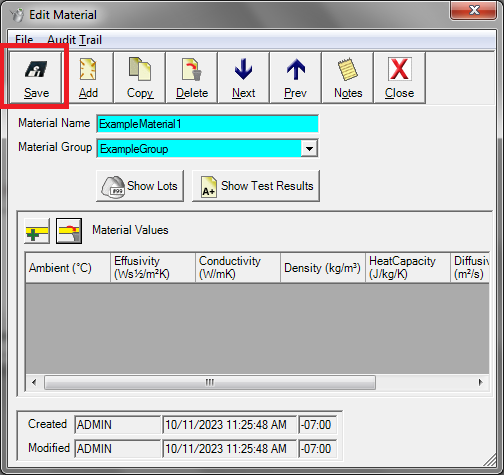
Categorizing your samples#
Test category hierarchy is shown from Fig. 35 through Fig. 41.
Creating a test method#
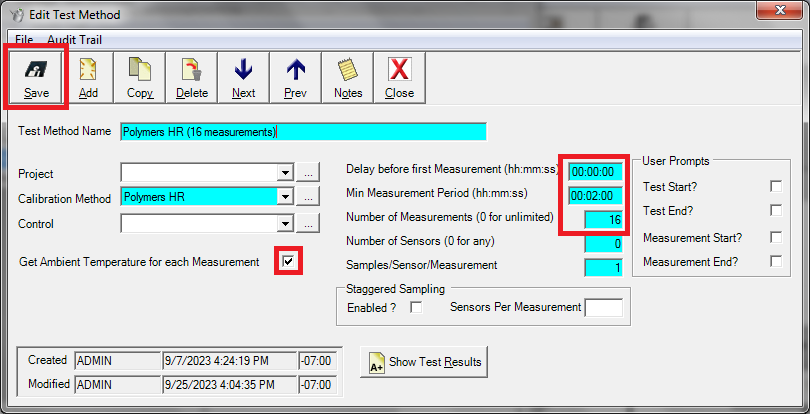
Test methods can be created or edited as in Fig. 42 and Fig. 43.
Alternative category navigation#
Sample categories connect to one another, allowing you to browse the Materials belonging to a Material Group, the Lots for each Material, and so-on. See this kind of navigation in Fig. 44 and Fig. 45.
Troubleshooting#
Here are a few issues encountered by our group, but the troubleshooting guide in section 8.4.2 on page 89 of the manual is more thorough. Find the manual in the black binder in Fig. 8 or in the searchable PDF in our lab’s Google Drive Shared Drive.
Something went wrong with setting a “Material Lot” at test time#
The software has a bug where if you don’t select “Contact Agent” before entering a new “Material Lot”, the test will try to start without properly creating the new lot. Make sure you select “Contact Agent” first, then create the new lot.
Thermal conductivity steadily decreases during a test#
Your material may be hygroscopic, meaning it absorbs water, and is absorbing the deionized water used as a contact agent, resulting in varying test conditions and a gradually decreasing thermal conductivity reading over time. Or you may be taking readings over an especially long interval, and the water is evaporating. You may use OMEGATHERM 201 thermal paste as an alterative contact agent if you are testing a hygroscopic material or taking measurements over a long time interval
Thermal conductivity readings inconsistent during tests or between tests#
Your sample may be too thin. See section 4.6 on page 33 of the manual, in the black binder in Fig. 8 or in the searchable PDF in our lab’s Google Drive Shared Drive.
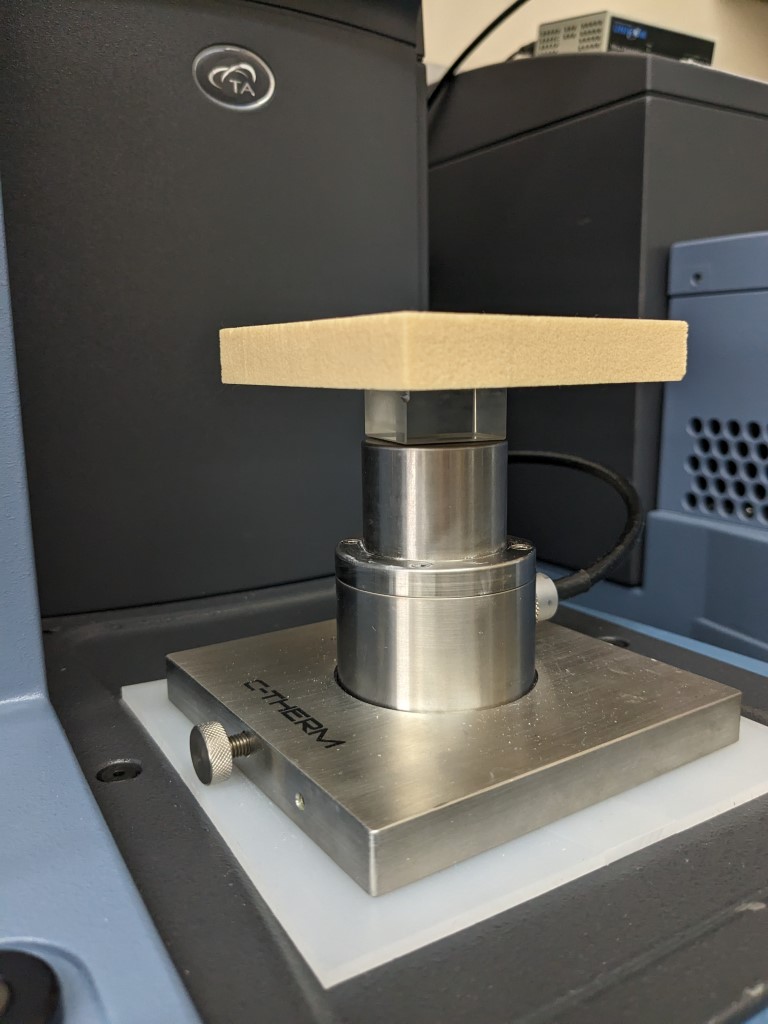
Fig. 46 Using the LAF 6720 foam reference sample for a blotter test#
Overlaying individual measurements#
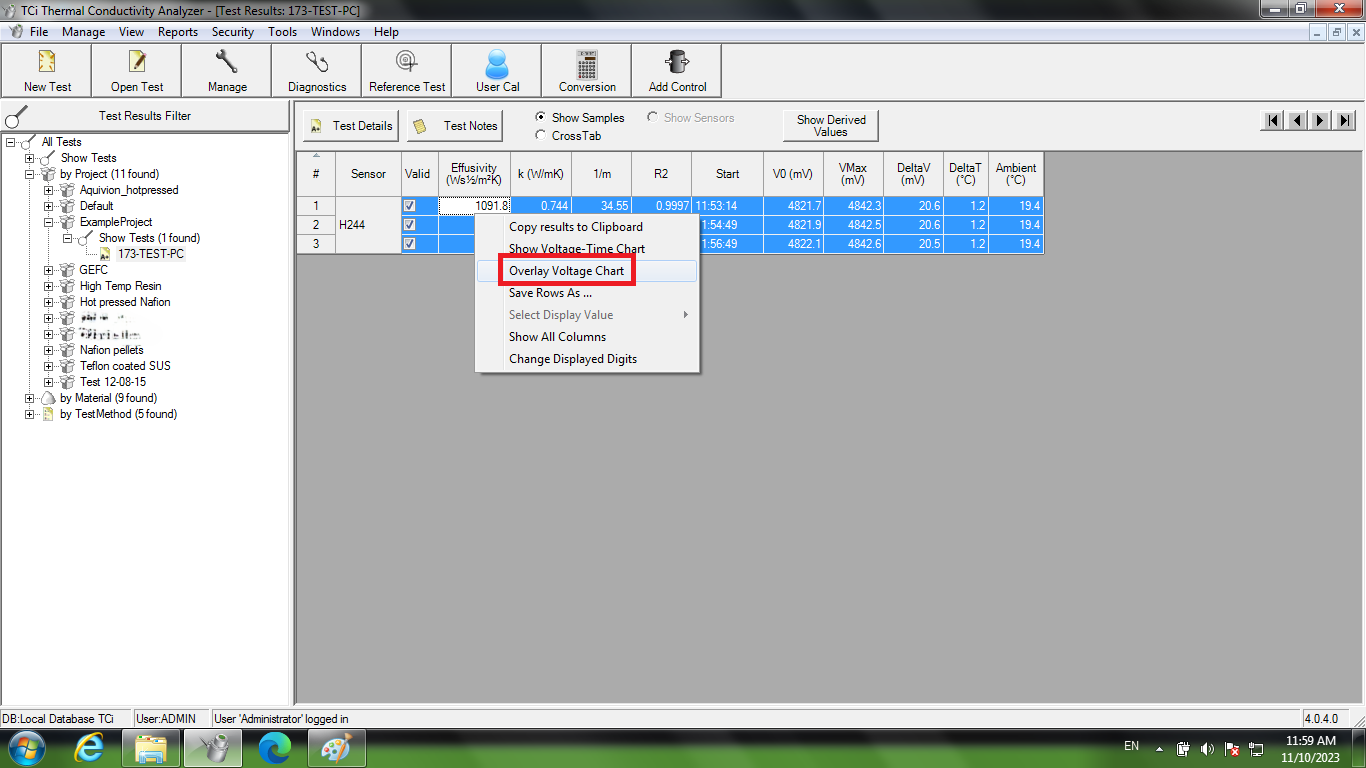
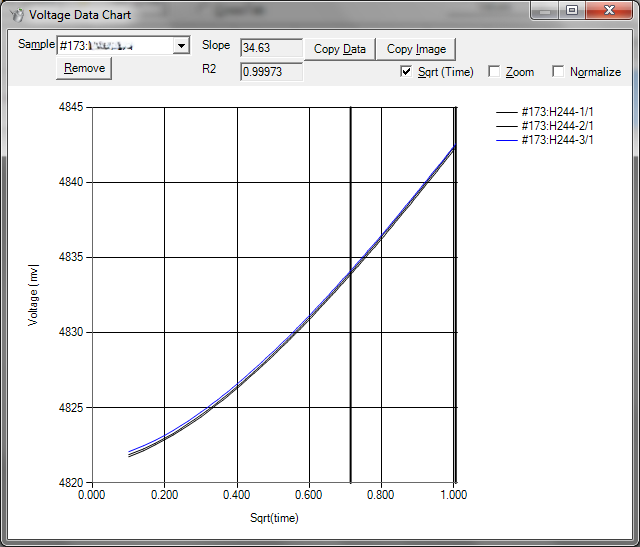
It is sometimes helpful to overlay the voltage-over-time curves of individual measurements when troubleshooting measurement inconsistencies. You can do this by right-clicking on a selection of measurements and selecting “Overlay Voltage Chart” as in Fig. 47. This will show the voltage data chart as in Fig. 48. For a good test, the curves should all appear similar, and with similar inflection. The latter fifth of the chart is linearized and used to determine thermal properties, so if inflection varies there, the resulting thermal conductivity will be different.
Test results aren’t updating#
The test results filter pane must be “reset” when new tests are taken as in Fig. 49. This re-populates the list of tests in the main window for browsing. This is only needed if you wish to browse the tests there, otherwise you can find and filter tests from the “Open Test” dialog.
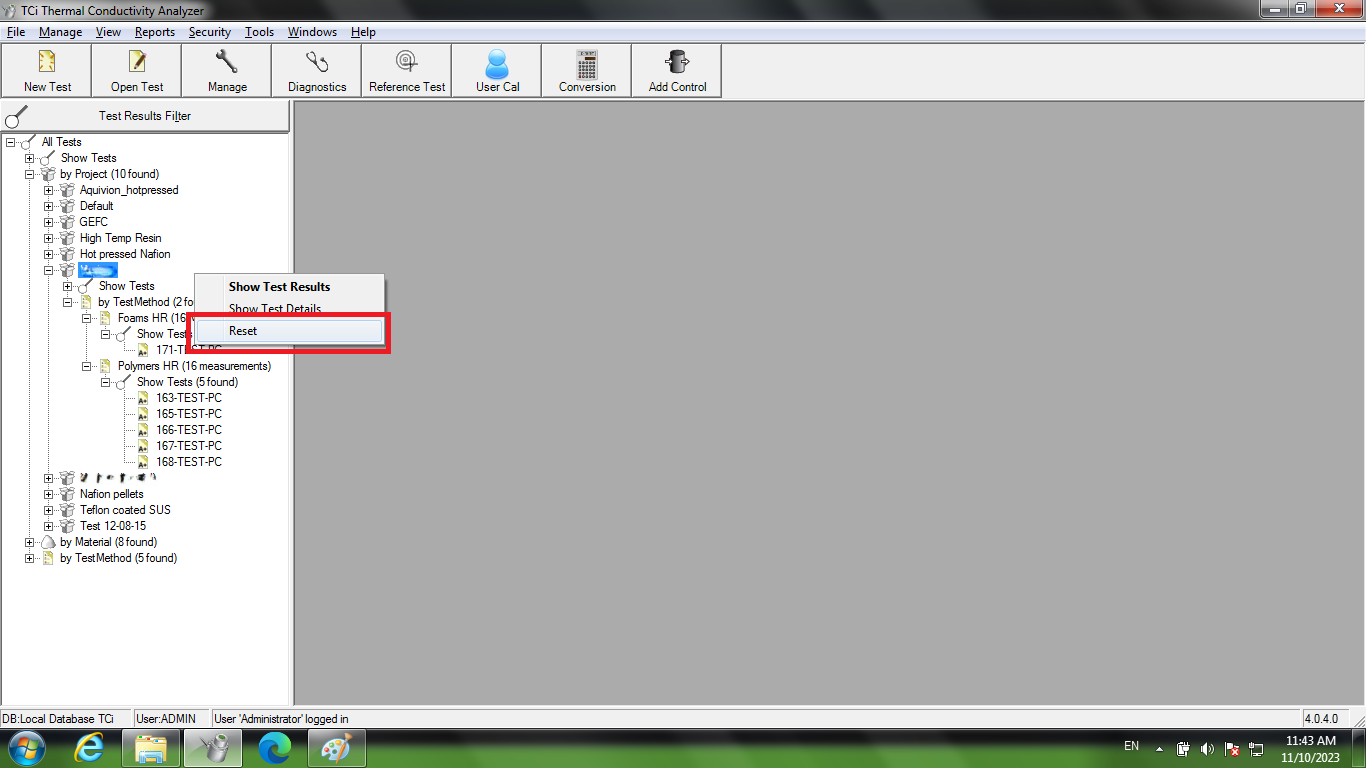
Fig. 49 Resetting the test results filter#